https://nicholasinstitute.duke.edu/sites/default/files/publications/rethinking-load-growth.pdf
“We estimate the gigawatts of new load that could be added in each balancing authority (BA) before total load exceeds what system planners are prepared to serve, provided the new load can be temporarily curtailed as needed. This serves as a proxy for the system’s ability to integrate new load, which we term curtailment-enabled headroom.”
This got a lot of publicity a few months ago and I can see why. With only 0.25% load curtailment, this paper estimates that 76GW of new datacenter load could be added to the US grid with no new transmission capacity needed. What’s more, the average curtailment duration in this scenario is only 1.7h and for 88% of curtailment hours > 50% of load could still be served! And if you’re willing to tolerate higher curtailment rates the new load capacity goes way way up: 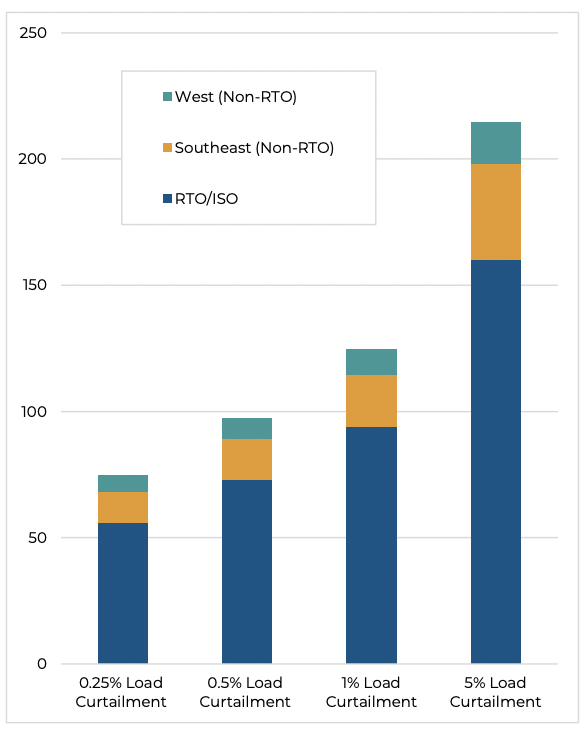
The assumption is that since most new datacenter load is being added for AI, that AI training (vs inference) is likely the best target for curtailment since it’s not in the serving path we should be able to time or spatially shift it.
Why is this important? For the DC construction this offers a faster route to deployment as it reduces the need for new generation and transmission infrastructure. It may also save them money if the alternative is special contracts that require absorbing some of the cost of this infrastructure. For consumers it can mean cheaper electricity, or at least a smaller increase in electricity costs when these giant new loads are added.
Update(2025-07-20): It also looks like US policy might be catching up: https://bsky.app/profile/tnorris.bsky.social/post/3ludan3ckjc2v: 
Questions
- What about batteries to cover the relatively few hours of curtailment? A few recent white papers on datacenter microgrids and availability/renewables tradeoffs (1, 2) make this seem reasonable, and this seems to be part of the business model of Verrus. This recent [podcast](https://open.spotify.com/episode/4FaZ1O6Pvcax7vn5Dw4T6F, 4h battery capacity ) describes adding 280MWh for a 70MW datacenter to allow running without needing the grid to provision for peaks. That’s 4h of battery capacity which seems like a reasonable fit for 1.7h average curtailment duration for 0.25% annual curtailment, but we’d have to see the distributions to be sure (paper only provides averages).
- There are live experiments happening with load curtailment as part of https://spectrum.ieee.org/dcflex-data-center-flexibility, I would like to see the results later this year.
Notes
- Analysis spans January 1, 2016 - December 31, 2024.
- Expected CAGR of US grid peak demand of 2-3% over next 5-10 years.
- Mostly due to large commercial customers
- DCs expected to account for up to 65GW (44%) of load growth the 2028/2029 and AI workloads 50-70% of that.
- Demand flexibility composed of: on-site generation, load-shifting, reducing workloads.
- Demand flexibility guarantees allow planners to provision for less generation and transmission capacity. This saves money, but also allows DCs to connect sooner.
- 76 GW of new load - equivalent to 10% of the nation’s current aggregate peak demand— could be integrated with an average annual load curtailment rate of 0.25%
- 98 GW of new load could be integrated at an average annual load curtailment rate of 0.5%
- 126 GW at a rate of 1.0%
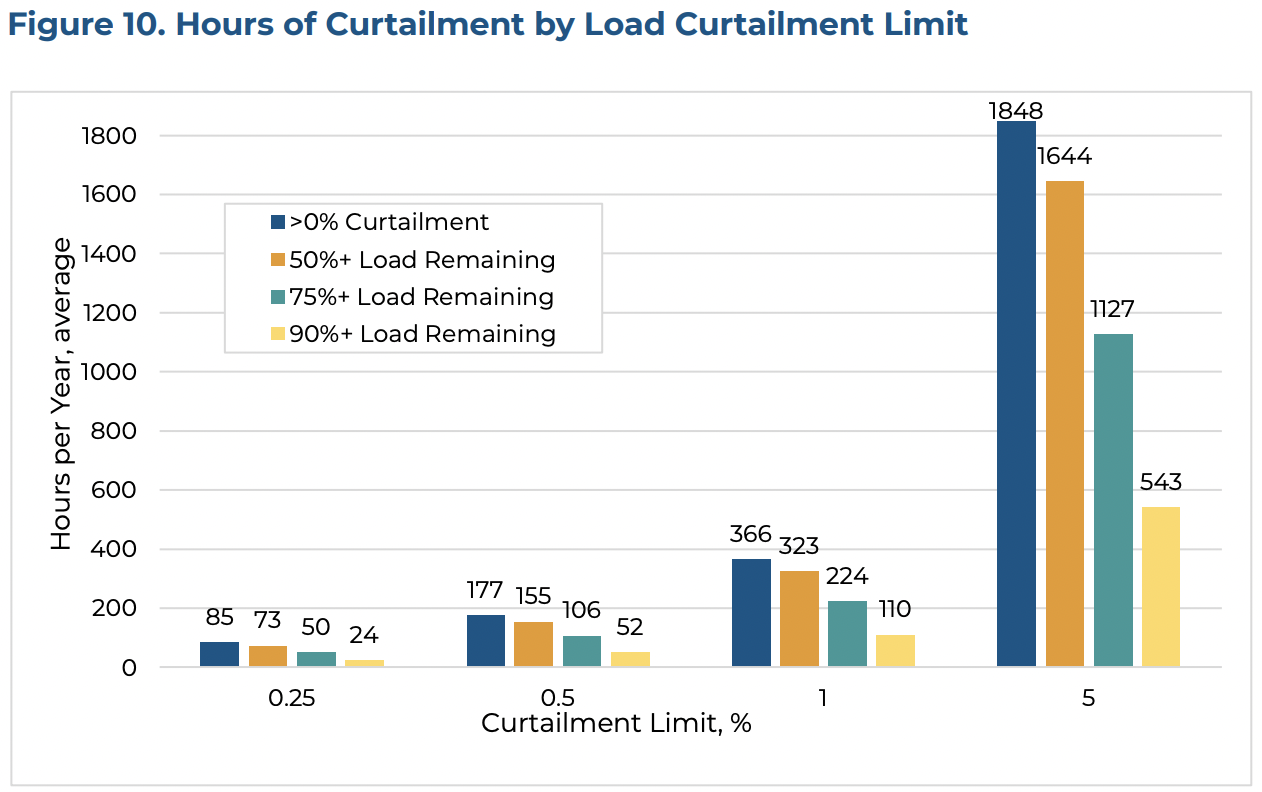
- The average duration of load curtailment is 1.7 hours when average annual load curtailment is 0.25%, 2.1 hours at a 0.5% limit, and 2.5 hours at a 1.0%
- ~90% of hours during which load curtailment is required retain at least half of the new load
- Analysis does not account for min up/downtime of power plants.
- If a new load requires firm interconnection service and will operate at 100% of its maximum electricity draw at all times, including during system-wide peaks, it is far more likely to trigger the need for significant upgrades, such as new transformers, transmission line reconductoring, circuit breakers, or other substation equipment.
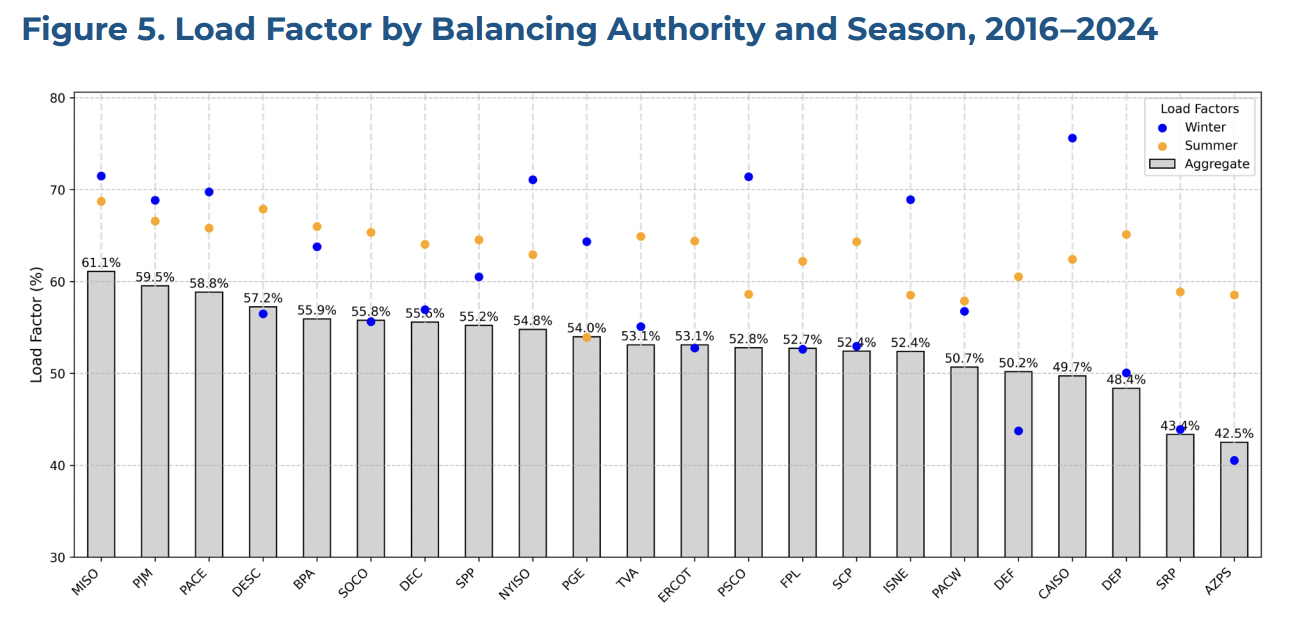
- load factor: ratio of average demand to peak demand over a given period and provides a measure of the utilisation of system capacity .
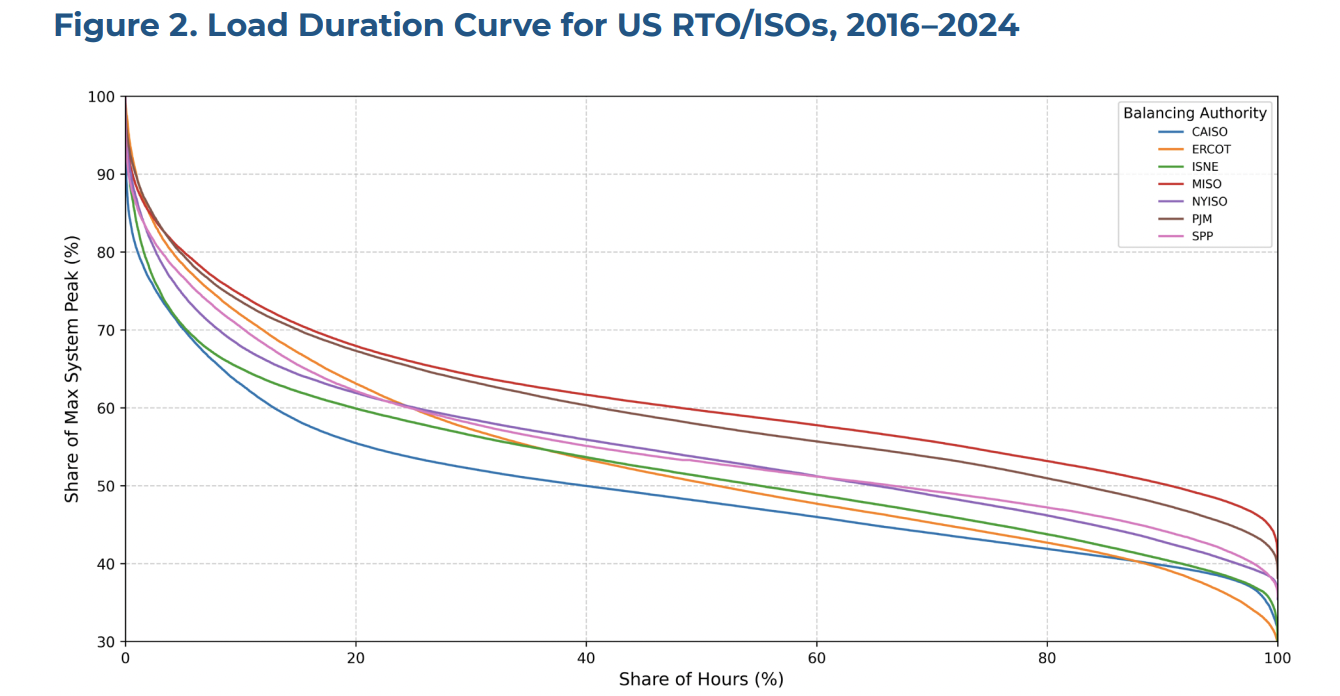
- Here’s a somewhat confusing graph that shows only a few percent of hours over several years have a load factor above 70-80%:
- Higher utilisation also helps existing customers by lowering the per-unit cost of electricity and reducing the likelihood that expensive new peaking plants or network expansions may be needed.
- The inverse is true for inflexible new loads that increase the system’s absolute peak demand.
- Demand response for DCs
- Largest and most established form of VPP (what are others, batteries, solar?)
- But DCs are usually designed on operated under assumptions of high availability, often with financial penalties for third party operators if not met.
- Multi-tenant DCs make it even harder to agree and coordinate for demand response.
- DCs and the loads they run are complex and can’t just be switched on/off. Significant infrastructure (hardware and software) and expertise is needed to make this work.
- EPRI are running a multi-year Data Center Flexible Load Initiative (DCFlex) since October 2024 to ” spark change through hands-on and experiential demonstrations that showcase the full potential of data center operational flexibility and facility asset utilization” in partnership with multiple tech companies, electric utilities, and independent system operators.
- AI-specific DCs may be better for demand shaping, especially for training (vs inference) where workloads should be time-shiftable.
- And there’s spatial flexibility, but that’s not specific to AI.
- Three types of things we could do to automatically reduce power consumed in a DC
- Lower voltage or frequency so that servers consume less power. This is scary to me.
- Have software reduce power consumption by reducing work done and packing remaining work onto fewer servers and shutting down idle servers.
- Reduce power to cooling systems (perhaps after ramping them up earlier). For hyperscalers with a PUE of < 1.2 or even 1.1 this won’t save much, but maybe for colos.
- DCs can also provide ancillary services like frequency regulation.
- According to EPRI, training an AI model accounts for 30% of its annual footprint, compared to 60% for inferencing the same model: https://www.epri.com/research/products/000000003002028905
- Verrus design DCs to be more flexible loads on the grid: https://open.spotify.com/episode/4FaZ1O6Pvcax7vn5Dw4T6F, 4h battery capacity (280MWh) to allow running without needing the grid to provision for peaks, plus some sort of adaptive power architecture in the DC that lets them oversubscribe total available power.
- Analysis
- Looks at three scenarios of max curtailment: 0.25%, 0.5%, 1%, 5%
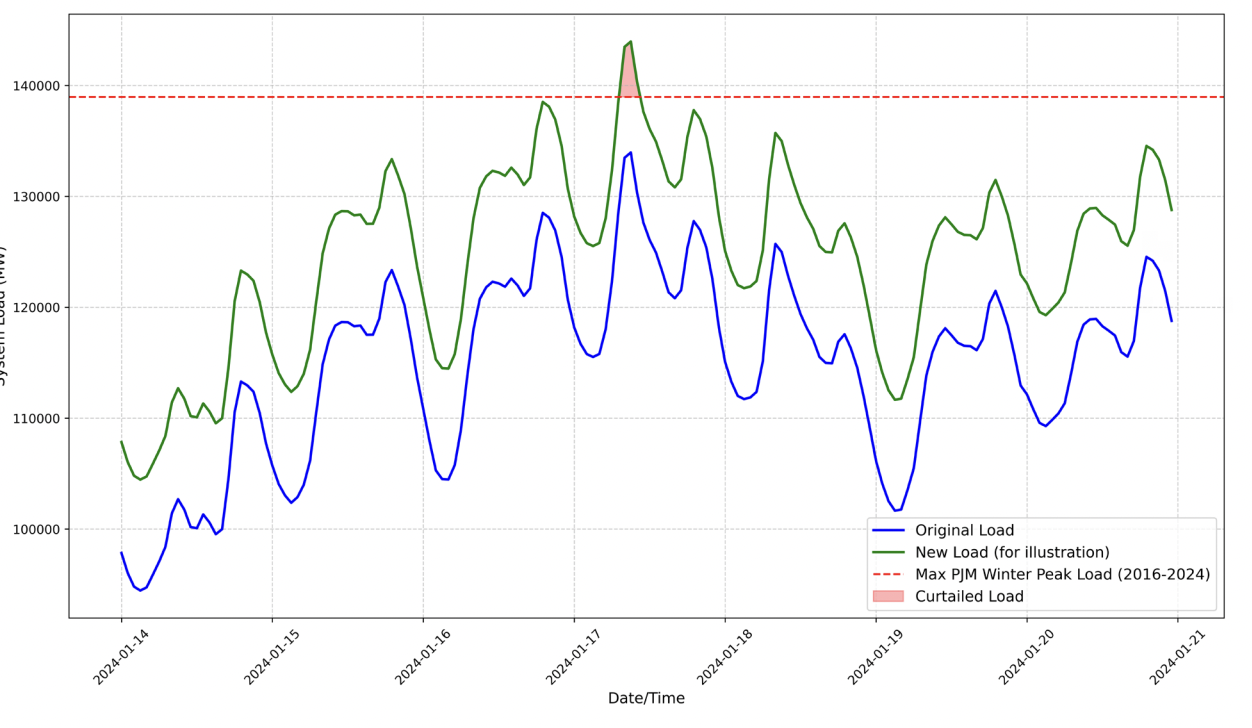
- Constraint: ensure system demand does not exceed historical peak seasonal (winter & summer) threshold:
- Assumed new load is constant (outside of curtailment windows)
- Curtailment was analysed for each year from 2016-2024
- Results
- Aggregate load factors ranged between 43% to 61% and the average and median winter load factor was 59% and 57% respectively, compared to 63% and 64% for summer (aircon I assume)
- headroom across authorities is 76 - 215 GW depending on the curtailment limit. That’s up to 215GW of load that could be added:
- Most hours during which load reduction is required entail a curtailment rate below 50% of the new load. On average, 88% of these hours retain at least 50% of the new load (i.e., less than 50% curtailment of the load is required), 60% of the hours retain at least 75% of the load, and 29% retain at least 90% of the load:
- The average curtailment duration was 1.7 hours for the 0.25% limit, 2.1 hours for the 0.5% limit, 2.5 hours for the 1.0% limit, and 4.5 hours for the 5.0% limit.
- Note that: analysis assumes the new loads do not change current demand patterns but rather shift the existing demand curves upward, and a more precise assessment of the potential for integration of new loads would require detailed characterization of the temporal patterns of the load.
- But is also likely underestimating available headroom by assuming max capacity available is equal to max demand served after throwing away outliers.