This is a six part course on power and emissions monitoring for IT equipment from the folks behind https://app.electricitymaps.com/
https://www.electricitymaps.com/content/lesson-1-introduction-sustainable-it-monitoring-grid-signals https://www.electricitymaps.com/content/lesson-2-introduction-sustainable-it-monitoring-grid-signals https://www.electricitymaps.com/content/lesson-3-sustainable-it-monitoring-journey https://www.electricitymaps.com/content/lesson-4-deep-dive-on-measuring-it-emissions https://www.electricitymaps.com/content/lesson-5-deep-dive-on-flexibility https://www.electricitymaps.com/content/lesson-6-summary-and-key-takeaways
It’s very high level stuff, with not much content in each lesson and a lot of repetition. Unless you’re very new to the space, there’s little here beyond a set of best practices and advice. Little to no technical content unfortunately.
Notes
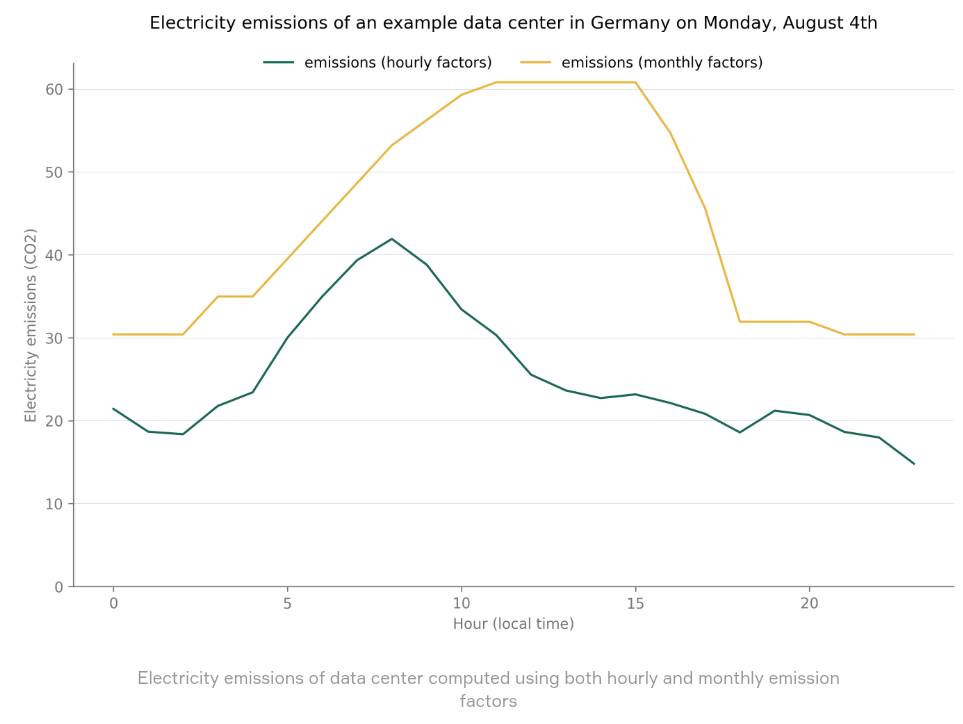
- Moving from a yearly to an hourly granularity improves accuracy by 20% on average worldwide, and by more than 40% in several grids…switching from a yearly to a monthly view already improves accuracy by more than 10% worldwide
- Note the difference in emission calculations when using the monthly average vs hourly carbon intensity
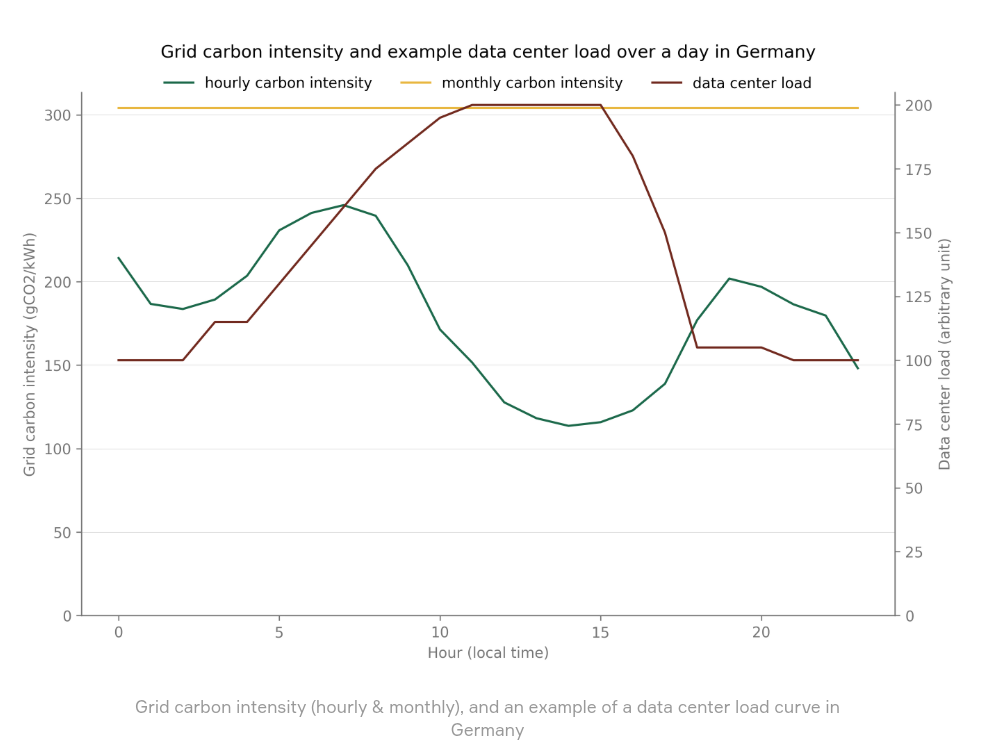
- The more granular the data, the better idea you have of what’s going on.
- Marginal carbon intensity estimates the short-term change in emissions induced by a change in consumption. This signal can unfortunately not be measured and thus cannot be validated against a ground truth. It led to major standards and regulations prohibiting their use, and we advise against using these factors.
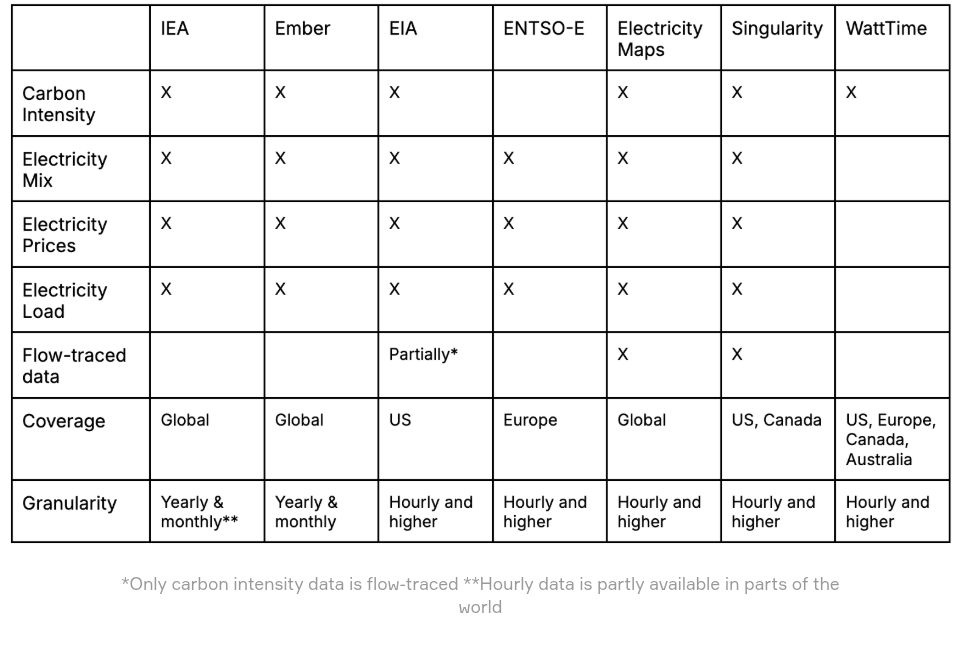
- https://transparency.entsoe.eu/: free, continuous access to pan-European electricity market data for all users, across six main categories: Load, Generation, Transmission, Balancing, Outages and Congestion Management - missing data for Ireland?
- And for the US: https://www.eia.gov/electricity/data/browser/
- To get a useful, coherent picture across multiple grids with multiple data providers, need to do a lot of data cleaning, aligning, aggregation and synthesis.
- Some sources for sanitised data:
- Mentions Green Software Foundation’s https://sci.greensoftware.foundation/
- Talks about some of the tools for measure carbon emissions for compute job (didn’t mention codecarbon!)
- Electricity Maps API has a carbon-aware optimiser that provides the optimal time and location for a given workload.