https://media.rff.org/documents/Prest_Fell_Gordon_Conway_2024_Updated_-_Combined.pdf under https://creativecommons.org/licenses/by-nc-nd/4.0/
I came across this paper in a bluesky post where @kevinkircher was pointing to potential GHG reductions that could flow from the US reducing oil and gas exports (although it turns out the paper authors explicitly say it’s more complicated for gas). I am very much not an economist so don’t know how valid this approach is (the model seemed kind of simplified) but enjoyed reading about their approach and learning a few things about supply/demand elasticity and market leakage (I had naively assumed it was ~100% most of the time).
“In this paper, we estimate the effects of […] supply-side interventions on global emissions, accounting for both market leakage as well as the relative emissions intensity of different sources of supply […] We find that the emissions reductions from supply-side interventions are on the order of 40–50 percent of the gross emissions of each barrel curtailed, depending on the relative emissions intensity of the curtailed and substitute sources of supply […] Further, targeting supply-side interventions at highly emissions-intensive heavy oils is likely to have greater impact on emissions.”
This is the core of the paper:
where
- is the emissions reductions achieved per barrel of oil curtailed.
- is the emissions intensity of the curtailed oil supply
- is the weighted average emissions intensity of marginal oil supply
- is the market leakage rate of oil
Or to put it in words: curtailing oil production in a location reduces global supply which raises prices by some amount (the authors do not assume perfect price elasticity). The price increase results in some amount of demand destruction, some amount of increased production in another location (leakage), and some amount of substitution (eg: people use EVs more in response to higher oil prices.). So long as leakage isn’t 100% and the replacement production and/or the substitutions aren’t much dirtier, then you get a net decrease in emissions.
Why won’t leakage be 100%?
- Oil field production has characteristics that mean they are not totally fungible, eg: oil type, location, refinery capabilities and costs.
- Limited production capacity of other fields.
- Scale up lag.
- Market structure, eg: OPEC caps, regulations.
- Delay of market signals propagating.
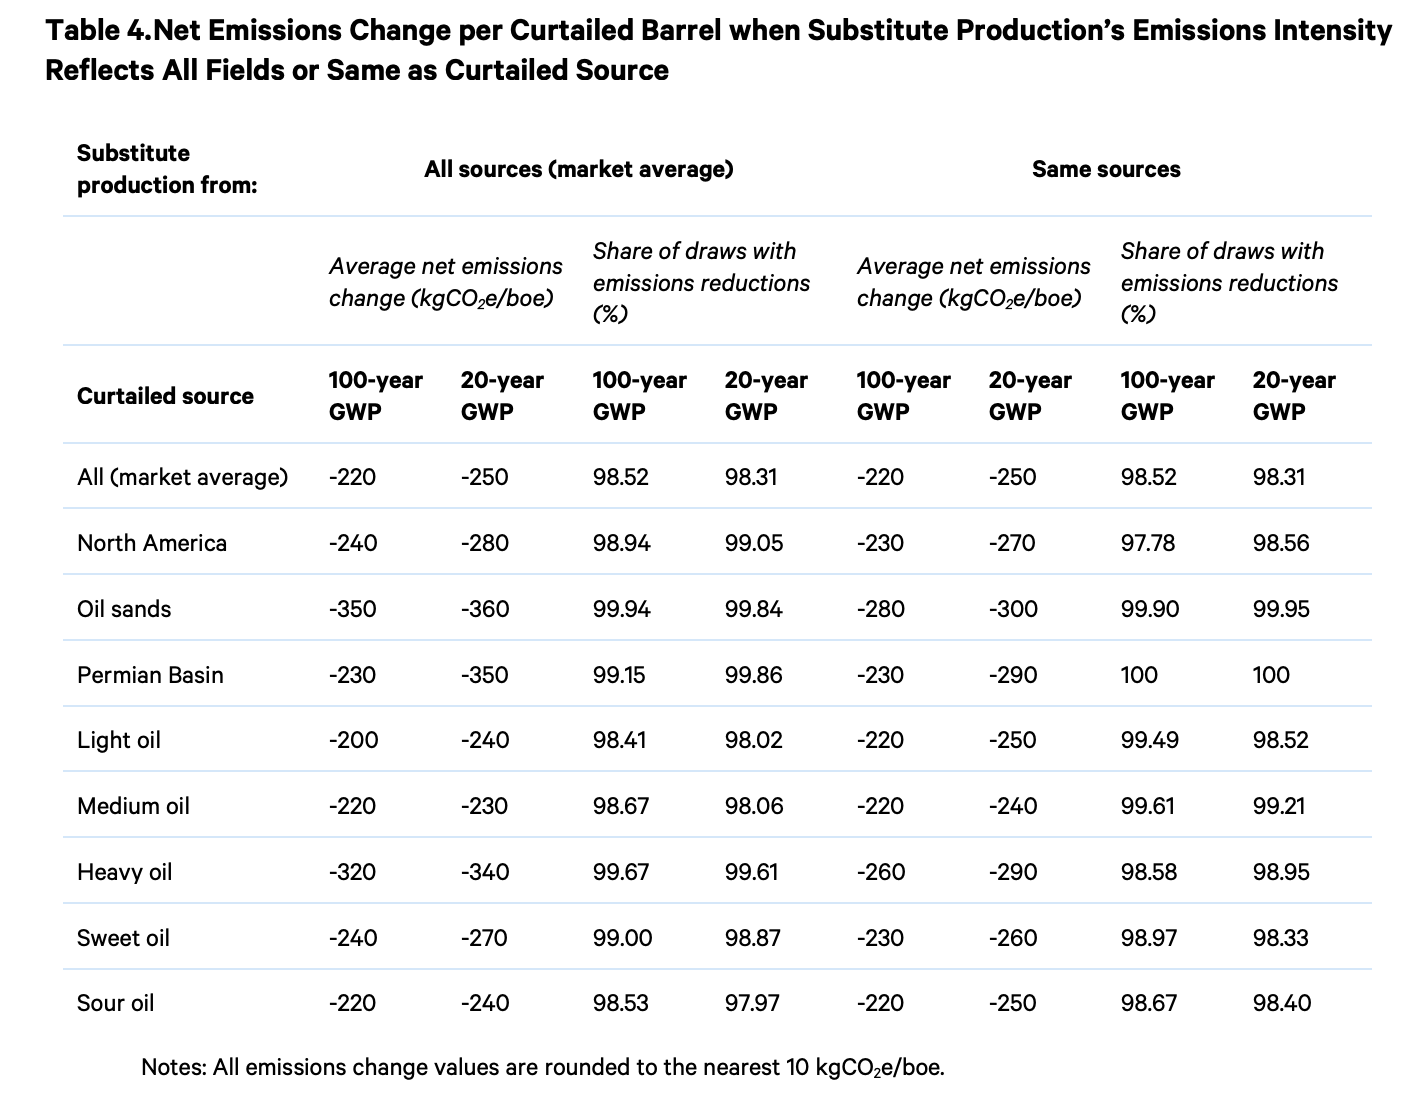
The authors ran a Monte Carlo simulation over a distribution of leakages and fields weighted by production size to produce distributions of emission reductions/increases. They did this globally and grouped by region and oil type 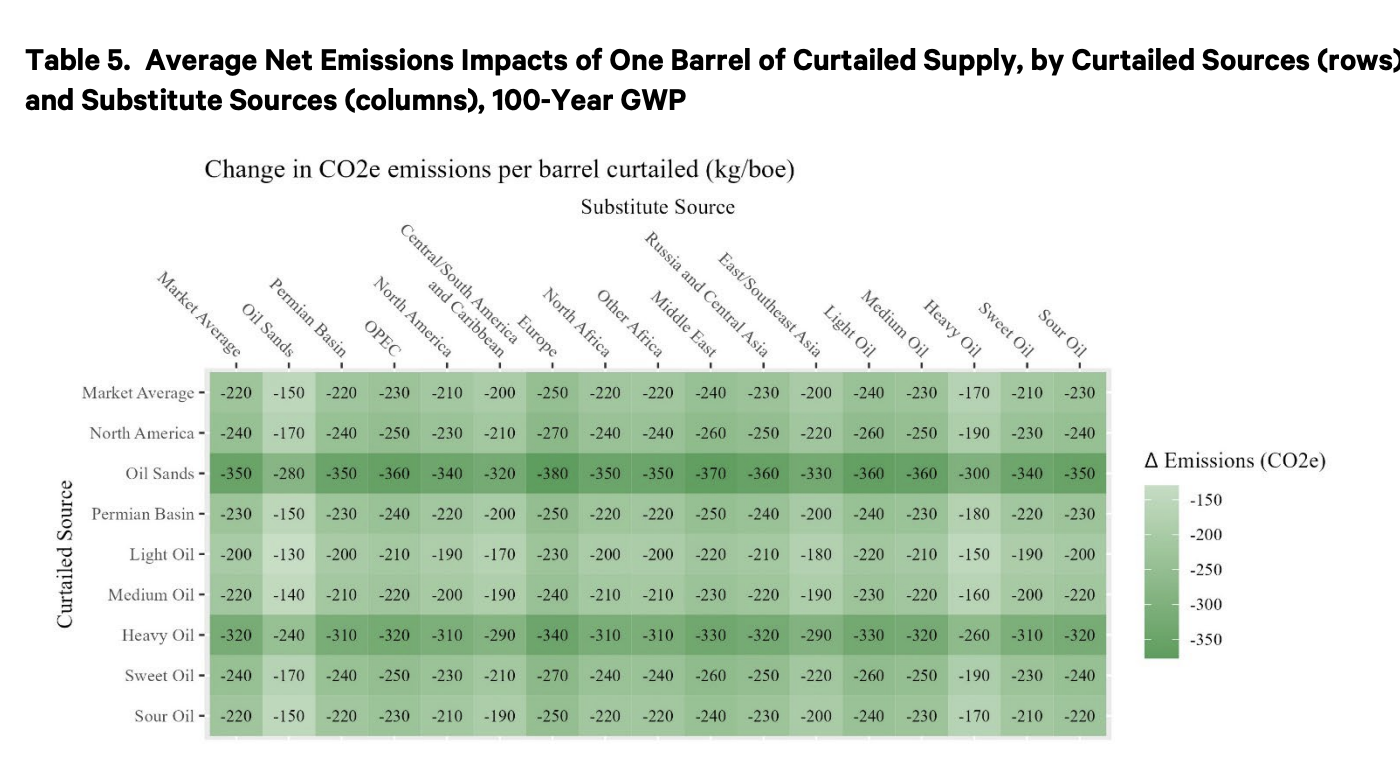
The above shows the outsized impact of curtailing the most emitting fields.
What about substitutions like EV’s and heatpumps? The authors provide the modified equation
where
- is the share of the demand reduction that is demand destruction
- is the emission intensity of substituted fuel sources
The authors don’t model this scenario, but note that “on one hand, reduce leakage by introducing another channel by which demand can respond (larger emissions reductions due to less leakage in equation, but, on the other hand, introduce emissions from substituted fuel (smaller emissions reductions)“.
The authors also point to “carbon retirement portfolios (Handler and Bazilian 2021) [that] would purchase emissions-intensive assets like oil and gas wells or coal-fired power plants simply to retire them. The resulting reductions in GHG emissions could then be monetised, for example by generating and selling carbon credits, or receiving direct payments from governments per ton of emissions reduced” - the methods in this paper seem like a reasonable approach to estimating the credits.
Notes
- Market leakage: reduced supply from one source is partially offset by increased production from other sources.
- cf elasticity: measures the responsiveness of one variable to a change in another. A high elasticity means a large change in demand for a small change in price, while a low elasticity means a small change in demand for a large change in price.
- The idea: reducing supply reduces GHG emissions through two mechanisms:
- reduces demand by some fraction of the supply reduction due to price sensitivity.
- if we pick the most emitting supply sources (eg: Canadian tar sands), then the fraction of replaced supply will likely be less emitting.
- Paper presents a supply/demand calculus model with the following assumptions:
- supply = demand (no stockpiles)
- not perfect or zero elasticity, but a range (good)
- These models seems awfully simple (in their model of the real world) in the way people often make fun of economics.
- , where
- is the emissions reductions achieved per barrel of oil curtailed.
- is the emissions intensity of the curtailed oil supply
- is the weighted average emissions intensity of marginal oil supply
- is the market leakage rate of oil
- All three inputs are uncertain, hence Monte Carlo
- How much of demand reduction is demand destruction vs substitutions? Eg: less driving vs use of EVs. This gives us an adjusted formula
, where
- is the share of the demand reduction that is demand destruction
- is the emission intensity of substituted fuel sources
- Substitutes typically have much lower emissions, eg: heat pumps, EVs
- This paper is too long for the points it is making (too many words in particular)
- Nifty, mapping oil and gas field emissions: https://ociplus.rmi.org/map
- Have to very roughly estimate field size since only size buckets are provided by this data set
vs
More variation in the 20-year GWP since that’s more sensitive to methane leak
- Monte Carlo
- Inputs: distributions of supply and demand elasticities sampled to create leakage distribution.
- Randomly pick curtailed source and substitute source fields weighted by by production size.
- Then randomly pick from the leakage distribution
- Also pick run simulations for 9 distinct categories of curtailed supply and 17 of substitute to reflect things like different emission levels, regionality, elasticity and oil type.
- “OPEC is about twice as price-responsive than average. Similarly, onshore North American supply is estimated to be more price-responsive than the global average”
- Results: