https://iopscience.iop.org/article/10.1088/1748-9326/add752/pdf
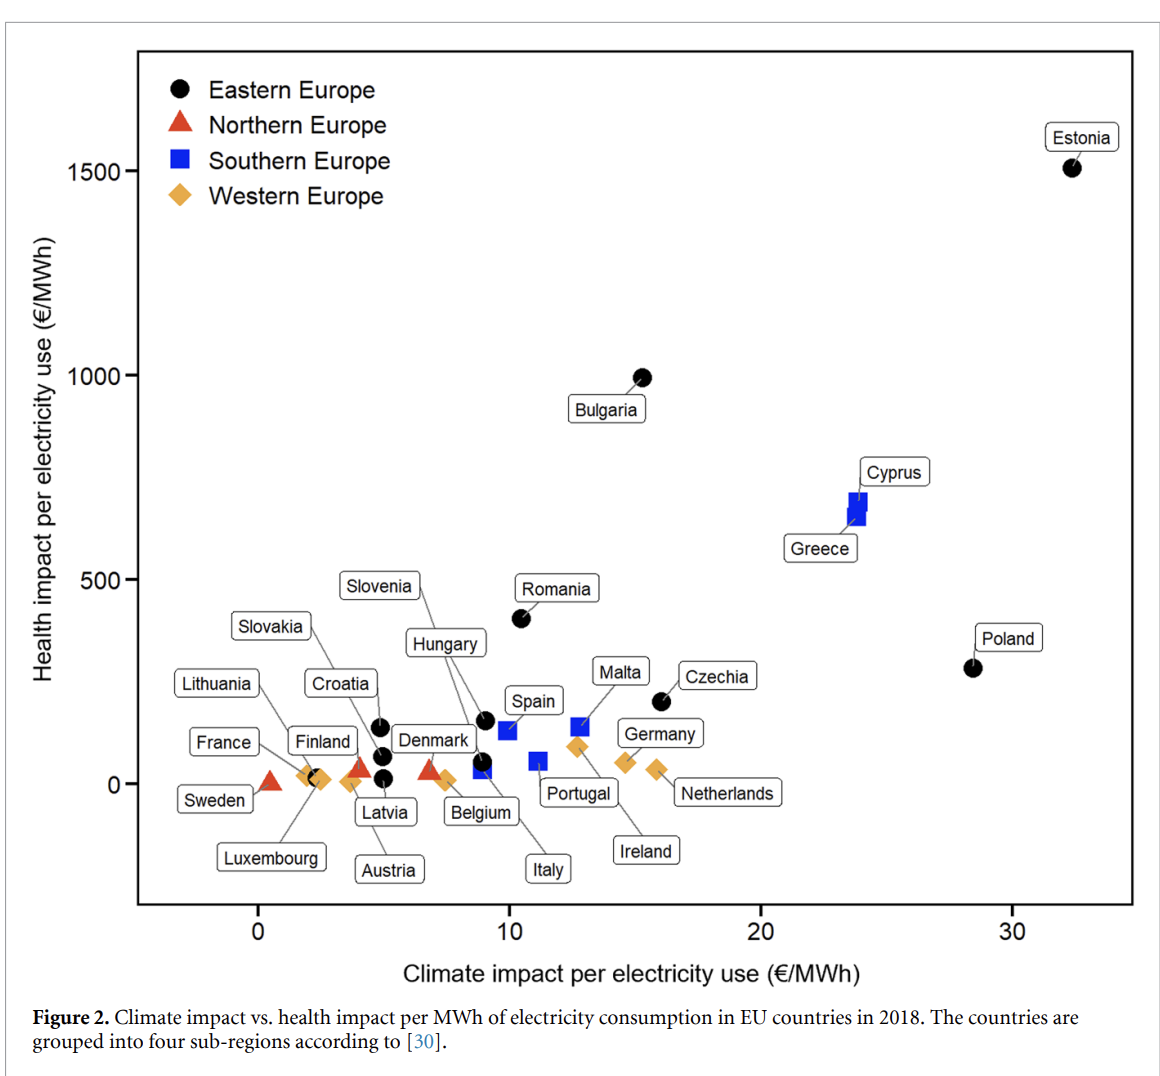
Abstract: Greenhouse gas emissions from burning fossil fuels are routinely counted in energy and climate policies, yet the immediate health burden of air pollution emissions from combusting these fuels is rarely quantified alongside. Particularly, the European Union (EU) comprises countries with diverse energy mixes, emission characteristics, reduction technologies, and policy frameworks leading to large variations in the impacts of energy consumption on climate, air quality, and public health. Understanding these country-level variations is critical to optimize regional energy policies and reduce climate and health disparities in the EU. This study quantifies the regional variations in both climate and health impacts of energy consumption across EU countries. In countries where coal or oil dominates power supply, the health impacts of electricity consumption can be larger than climate impacts by more than ten times (e.g. Bulgaria, Romania, and Greece), highlighting the necessity of incorporating health impacts into climate and energy policies. We found a significant variability in health impacts per electricity usage (1.4–1508 € MWh−1) among EU countries, largely driven by their energy source mix. The health benefits of sustainable energy strategies can be notably higher in Eastern Europe countries than those in Western or Northern Europe. For instance, saving the same amount of electricity in Estonia could achieve health benefits 1043 times greater than in Sweden. Furthermore, our results suggest that energy policies and reports with biomass lumped into renewables can overlook its potential health burden. The dataset of climate and health impact factors produced in this study can be useful for future research, practice, and policymaking to quantify the burdens of energy consumption or assess the benefits of energy efficiency measures in the EU.
This paper calculates and compares the climate costs (based on the social cost of carbon) of CO2 and other greenhouse gasses, and the health costs of other pollutants (SO2, N20, NOx, particulates) from energy production across the EU. I am skeptical that you can assign a single monetary value to these things and directly compare them (it’s hard not to flinch when you see “Value of Statistical Life” in a calculation), but even so a few things are striking:
- Air pollution in the EU is associated with around 300k annual premature deaths and a significant number of diseases.
- Climate costs from GHG emissions are modelled globally because GHGs don’t stay in the country where they are produced, but health costs are modelled at the country level because pollutants have much more of a local impact.
- There is much larger distribution in the health costs vs the climate costs across different fossil fuels. For example, coal has 2x the CO2 emissions of CH4, but ~100x the SO2 emissions.
- Biomass/biofuels have a relatively low climate cost but high health cost.
- All the above combined with the fact that different countries have very different energy production mixes adds up to a) Health costs being much higher than climate costs b) Much wider variation in health costs than climate costs c) Greater benefits can be had deploying renewables in eastern Europe than western Europe.
Questions
- Climate impact is calculated based on the social cost of carbon (SC-CO2)and health impact based on deaths attributable to pollution, but SC-CO2 includes changes to human health, so is there overlap or double counting?
Notes
- Air pollution in the EU is associated with around 300 000 premature deaths and a significant number of diseases such as asthma, lung cancer, and cardiovascular problems each year .
- Latest edition of the EU’s Energy Efficiency Directive requires members to collectively achieve an 11.7% reduction in energy consumption by 2030 vs 2020.
- Emission factors (EFs) of CO2 equivalent (CO2e) for grid electricity production in the EU available from the European Environment Agency: www.eea.europa.eu/data-and-maps/indicators/overview-of-theelectricity-production-3/assessment
- Emission data of CO2e and pollutants (CO2, CH4, N2O, PM2.5, SO2, and NOx) available from the Emissions Database for Global Atmospheric Research (EDGAR): https://edgar.jrc.ec.europa.eu/emissions_data_and_maps
- Country-specific data of power transmission and distribution losses provided by International Energy Agency: https://data.worldbank.org
- EFs of different fuels from IPCC Guidelines for National Greenhouse Gas Inventories (for GHGs): www.ipcc-nggip.iges.or.jp/public/2006gl/
- EMEP/EEA air pollutant emission inventory guidebook (for air pollutants): www.eea.europa.eu/en/analysis/publications/emep-eea-guidebook-2019)
- Social cost of carbon (SCC) to estimate the potential monetary impacts of climate change attributed to GHG emissions from energy consumption: https://19january2017snapshot.epa.gov/climatechange/social-cost-carbon_.html
- The SC-CO2 is a measure, in dollars, of the long-term damage done by a ton of carbon dioxide (CO2) emissions in a given year. This dollar figure also represents the value of damages avoided for a small emission reduction (i.e., the benefit of a CO2 reduction).
- Results
- Climate benefits are modelled globally (since GHGs travel globally), but health benefits on a country level (since they tend to travel less far)
- Biomass/fuels are relatively low climate impact but high health impact. They are a large energy source in Estonia and Hungary
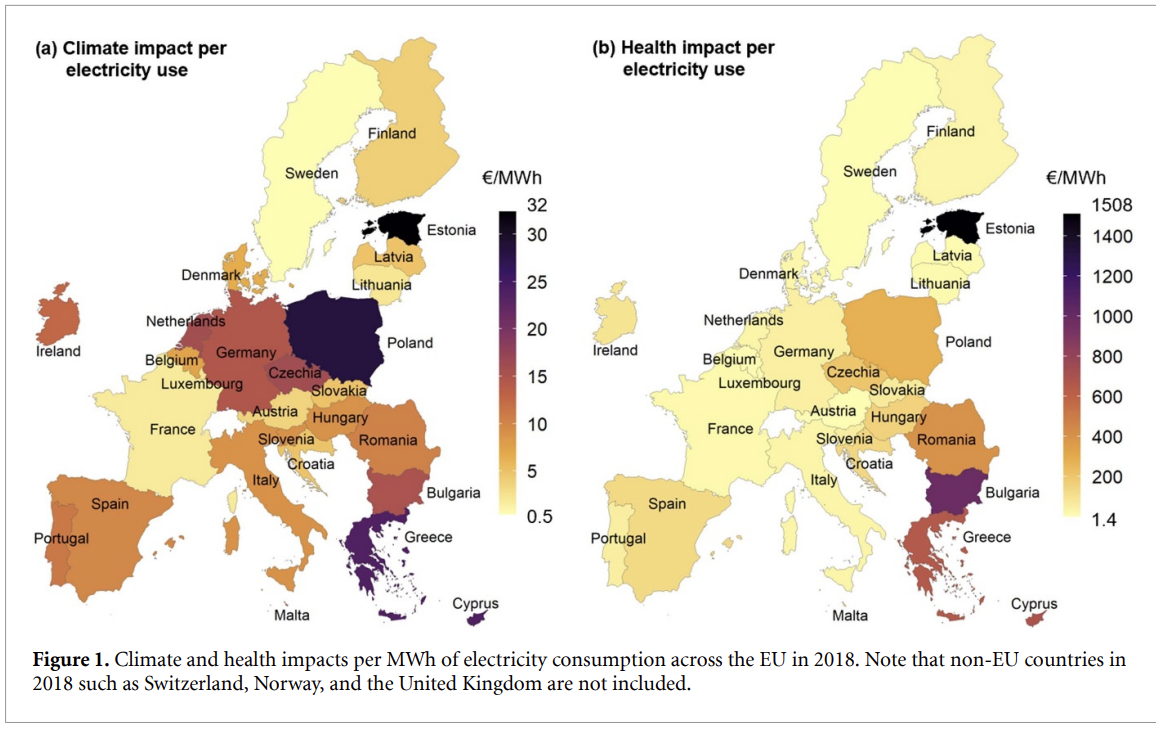
- Highest climate and health impacts where for countries with dirtier mixes of energy sources
- Health impacts can be considerably higher than climate impacts where coal or oil dominate energy generation. This is because CO2 equivalent varies much less between fuel types than pollution does, eg: coal is ~2x CO2 of methane, but ~100x for SO2. Age of coal plants also plays a large role in how efficient and polluting they are.
- Show’s that greater benefits can be had deploying renewables in eastern Europe than western Europe.
- Also that it may be more effective to highlight health benefits than climate benefits in some locations.
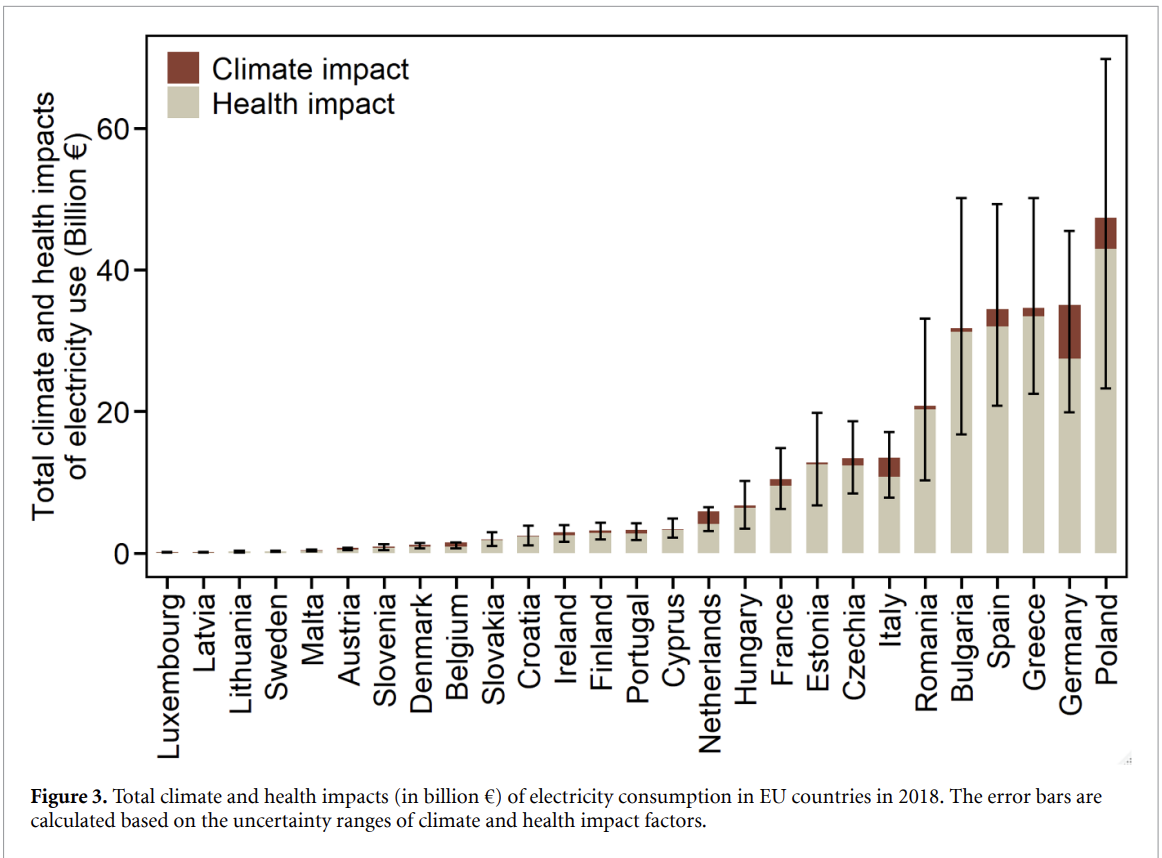
- Total health impact looks way higher than total climate impact in many countries.
- Study shortcomings
- Ozone-related health outcomes and other air pollutant emissions, such as volatile organic compounds, NH3, and CO, were not included due to lack of related data, which may lead to underestimation of the health impacts
- Didn’t account for international electricity flows